
What is The Definition of "Slow"?

The Client’s Challenges
How can you fix what you can’t detect? When users of your application say, “It’s too slow,” is it because of the database, the network, a third party vendor, or the application itself? Is it convincing to say performance is improving without independent data to show it? This is where the concept of monitoring comes in.
Russell Reynolds Associates (RRA), one of the premier retained executive search firms in the world, was having just such a problem. They were converting a desktop application used in some 40 offices around the world to an ASP.NET application. This substantial effort was hampered by architectural constraints, making it difficult to reproduce bugs that users reported. Developers, infrastructure engineers, DBAs, business analysts, managers and executives alike were all affected and concerned.
Partners at RRA wanted to know that their significant financial investment in this application migration was worthwhile. Everyone was under pressure to show that problems could be found, and that a credible plan would be made to fix them.
What We Did
As part of our platform architecture work, we were asked to undertake a search for a monitoring solution. The existing tool was great…if you were a technical person. It was also limited because it only checked for a heartbeat periodically, and it would miss problems that users had in real time.
Part of our consideration in tailoring the solution was to recognize that spikes would occur at different times of the day because users were spread across the globe in different time zones. Certain pages also naturally took longer to load than others, and therefore the definition of “slow” could vary.
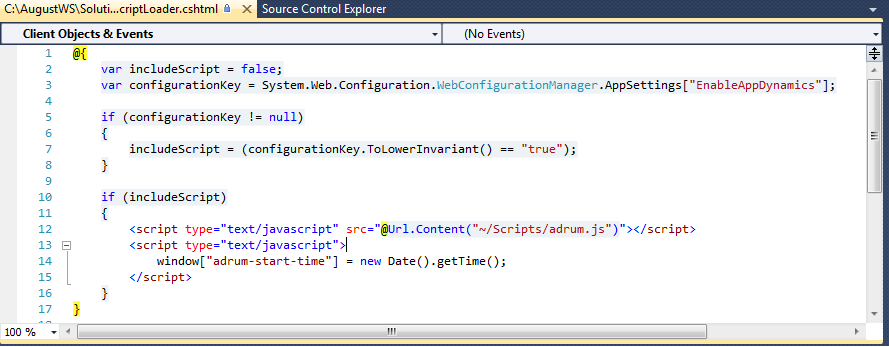
We needed a product that didn’t take an army of people to set it up, configure and maintain. We also needed something user-friendly, that people could start experimenting with after a minimal amount of training. We also had to take additional steps make sure that the solution met security protocols, and that javascript injections would not further degrade the speed of the applications.
The Impact
Prior to this solution, the development manager and senior development architects could only rely on their own credibility to convey information to end users on the business side. By creating an internal portal, any stakeholder could simply log in to view a real-time dashboard with the most relevant metrics.
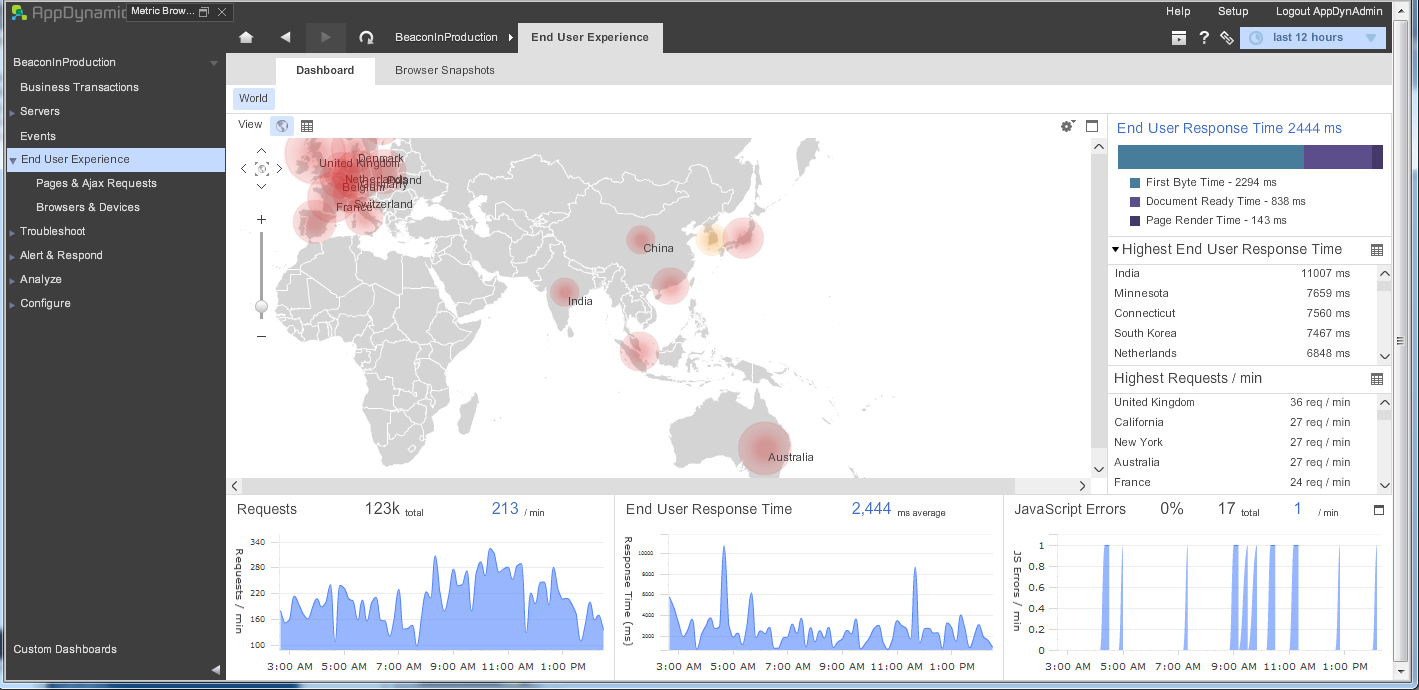
There was a second by-product. We were early adopters of AppDynamics, a product that was primarily meant to monitor Java applications. At the time, we were the only ones to customize it extensively for .NET applications. As such, we were able to contribute a significant amount of content to AppDynamics’ online help files, particularly at the intersection of making Unix and .NET play nicely together.
AppDynamics also invited us to present to their clients during a technical meetup session. Download the full presentation here